
NASA is pure Americana, Apollo missions, ISS, Mars rovers… countless iconic projects. Less visibly, NASA gave us a quieter idea that would outlive rockets: the Digital Twin (”DT”). Starting around the 1960s this concept was born and “coined” as a term in the early 2000s by Michael Grieves and John Vickers. A Digital Twin was a way to mirror complex physical systems, simulate them, reason about them, and intervene before failure. Aviation, manufacturing, maintenance: anywhere atoms mattered, Digital Twins thrived. But when you carry that idea into software, things get strange. Hardware is bounded. Software and data are not. You’re no longer modeling stress, heat, or vibration, you’re modeling logic, semantics, ownership, and intent. Anything can be “virtualized,” but not everything can be understood the same way.
How do we model businesses? The modern data stack gave us the path to do this by massaging company data into tabular storage. We transform that data into “actionable insights” and throw that into a dashboard and, voilà, you have an analytics stack. Scale your analytics team to keep up with requests from the rest of the business; plumbers et al. - we went over this last time. The reality is dashboards display your data in a human readable way, which I will not deny, is extremely useful. However, I’ll pose a question; given the following graph how would you answer the following question: “Why did revenue go down?”
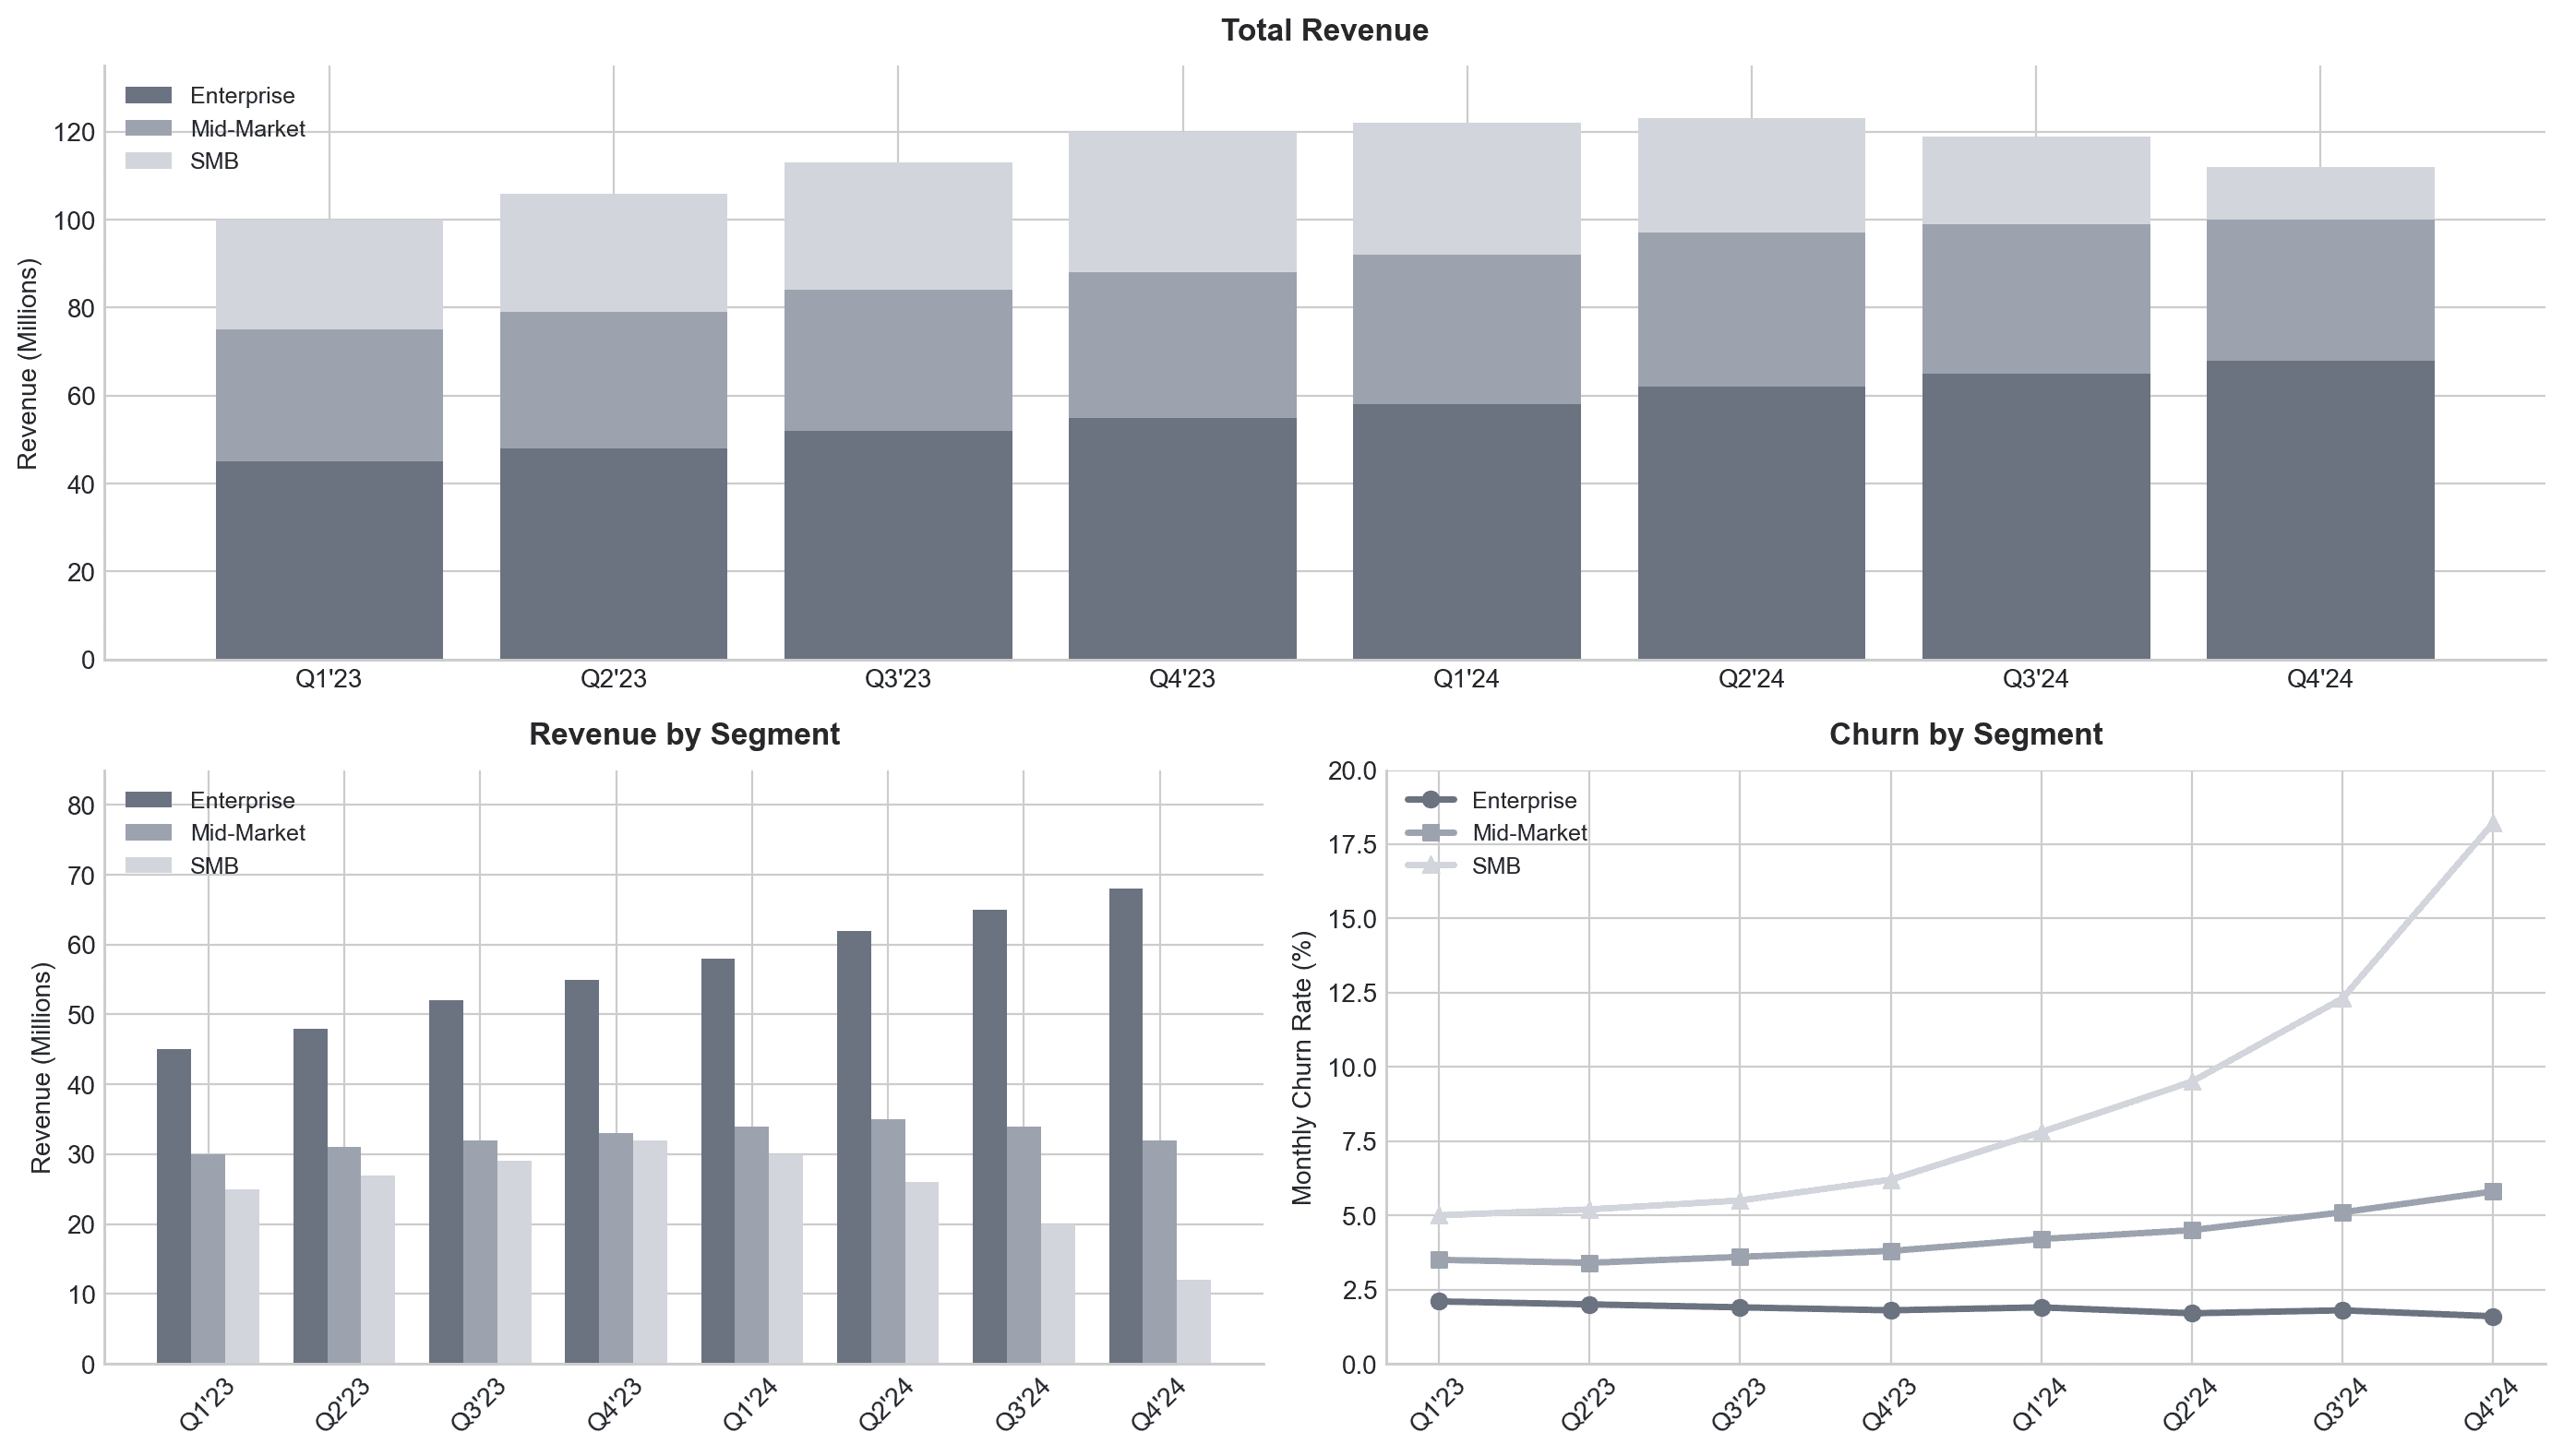
Couple of simple answers:
“SMB revenue is trending down”
“We had some customers churn”
These are the drivers, but why did those things happen?
This is where purely modeling tabular data can fall short. While this is a great top down view of metrics, and crucial starting point for understanding a business, it fails to go beyond the retrieval and display.
The main enterprise application of AI is currently chat interfaces, but what insights do you get with slapping chat onto a dashboard? Just an explanation of the line graph? Maybe you throw your sales meetings into a vector database and try to find which objections are common in SMB renewal meetings? What are the drivers of these objections? Okay, I’ll stop with Socratic recursion. There are clearly limits to SQL-based retrieval and vector RAG… namely there is currently no substitute for tribal knowledge at your organization. The glue that connects metrics to underlying drivers are humans and how do humans think? They think in systems. They are not retrieval machines as much as they are an API between unstructured reality- think “Company X churned because our customer support was slammed and they had a bad onboarding experience.” These are distilled relationships and causality that goes beyond tabular data modeled in a data mart. This is system level understanding.
A churn event isn’t just a row in a table. It’s the collapse of an entire lifecycle. It’s the intersection of:
Early qualification and discovery meetings
A customer record in the CRM
A defined customer segment
Sales cycle SLAs and handoff timing
The originally booked deal and expectations set
Onboarding support tickets and time to value
The humans involved: SDRs, account executives, customer support
The churn event itself
Each of these can live in different systems. Each carries context that never shows up in a dashboard. When churn is modeled as a status change in a CRM, you lose the story. When it’s modeled as a lifecycle, you can reason about causality.
That distinction is the difference between reporting churn and understanding why it happened. Building this concept requires not only data, but a human-in-the-loop workflow that is not intrusive.
Digital Twin conceptually applied to a business looks like:
High and low level entity identification
Causal relationship modeling
Semantic modeling
Not only does this give the keys to CEOs to fully understand their business, but it also gives agents the map to understand a business at a semantic level. While knowledge graphs are not new, they are under-appreciated and sparingly used. Graphs will be the reasoning engine for AI however without careful cultivation and application of semantic modeling you can be left with the same slop that ends up in your data warehouse. Wiring semantics at both the application and analytics level are sorely needed. Data warehousing is second nature, but semantic layers and data cataloging are “advanced” concepts in the data engineering stack.
NASA didn't build Digital Twins because simulation was trendy, they built them because you can't intervene on a system you don't understand. The same is true for your business. Dashboards show you what happened. A Digital Twin shows you why and what to do about it. The companies that figure this out first won't just be “AI ready.” They'll be the ones whose AI actually works.
Interested in learning more about Galaxy?


" height="24px" id="PKt6RW0lu" width="24px"/></g></svg>)
" height="23.247157673850985px" id="M3DBdZhx2" width="24px"/></g></g></svg>)
" height="24.5274px" id="bTanG43xy" width="24px"/></g></svg>)
