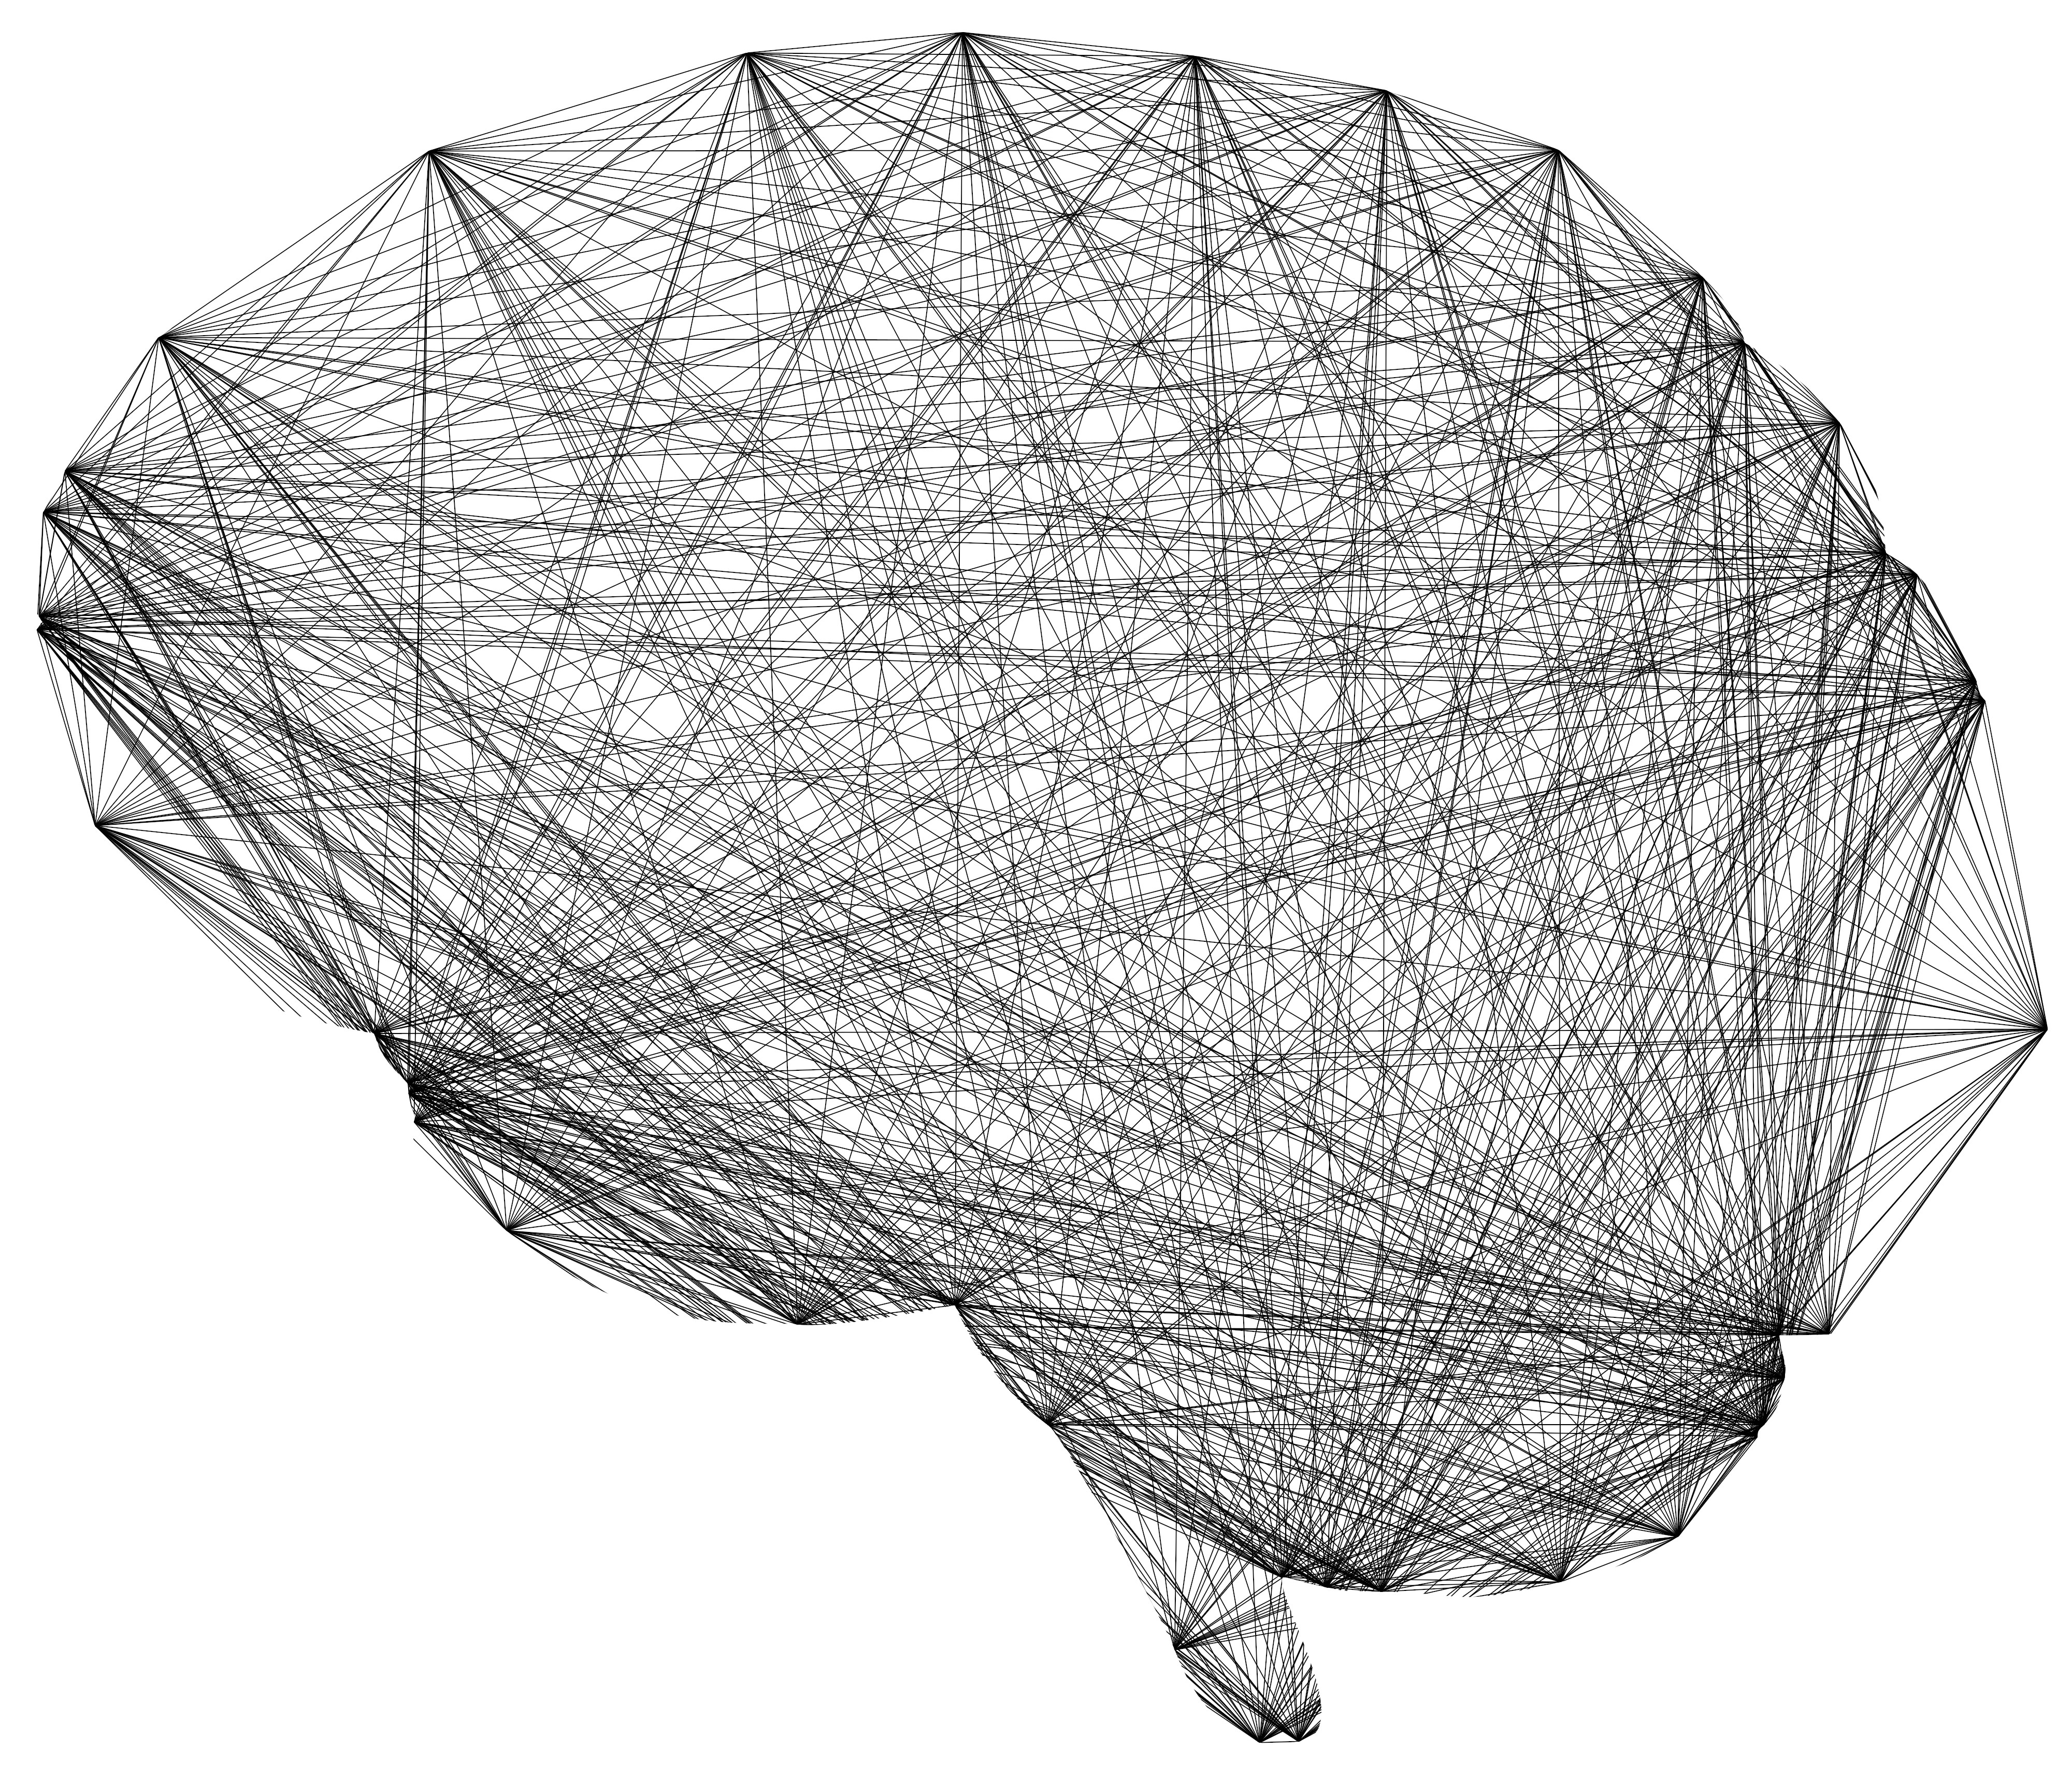
A knowledge graph is a way to organize information around things and how those things connect. Instead of storing data as isolated rows in tables, a knowledge graph models real-world entities such as customers, products, systems, documents, or business terms, then links them through relationships like "owns," "depends on," "belongs to," or "works with." IBM describes knowledge graphs as structures that integrate data into a network of entities, relationships, and semantics, which makes meaning easier for both humans and machines to understand.
That structure matters because context is built into the model. In a knowledge graph, "Acme" is not just a text string. It can be defined as a company, connected to a parent organization, tied to specific products, mapped to internal systems, and linked to the teams that use its data. Google's developer documentation similarly frames the Knowledge Graph around entities and the facts associated with them. Neo4j also explains that knowledge graphs represent entities, relationships, and categories in a graph structure, which helps surface meaning that would otherwise stay buried across disconnected sources.
Compared with a traditional relational database, the difference is less about storing data and more about representing meaning. Relational databases are excellent for structured transactions and repeatable queries, but they usually require rigid schemas, joins, and extra modeling work to capture complex connections. Graph-based systems are designed to treat relationships as first-class data, which makes them better suited for exploring interconnected information and evolving business context. Neo4j's overview of graph databases versus relational databases is useful here. In short, a traditional database tells where data lives; a knowledge graph helps explain what the data means and how it fits together.
How a Knowledge Graph Works
A knowledge graph organizes data as a network of entities, relationships, and attributes. Instead of storing information as isolated rows in separate systems, it maps how things connect: a customer belongs to an account, an account owns products, a product supports a workflow, and each object carries business meaning. The core components usually include a semantic model or ontology, entity resolution logic, relationship mapping, metadata, and a graph store that can query those connections efficiently.
The semantic model is what makes the graph useful across systems. It creates a shared business layer over fragmented source data from CRMs, warehouses, ERPs, support tools, and documents. That layer standardizes definitions so "customer," "account," or "product" mean the same thing everywhere, even when source schemas differ. In practice, the graph links records that refer to the same real-world object and preserves the context around them, rather than flattening everything into disconnected tables.
That context is the key advantage for AI. Large language models are strong at generating language, but weak when enterprise meaning is ambiguous or spread across systems. A knowledge graph gives AI structured context: what an entity is, how it relates to others, which facts are authoritative, and what constraints matter. This improves retrieval, reasoning, and answer quality because the model is grounded in relationships, not just keywords. In short, a knowledge graph helps AI move from pattern matching to context-aware understanding.
Knowledge Graph vs. Other Approaches
A knowledge graph is often confused with adjacent technologies, but the differences matter in practice.
Knowledge Graph vs. Data Warehouse
A data warehouse is built for analytics at scale: structured reporting, dashboards, historical trend analysis, and SQL-based aggregation across large datasets. It excels when the goal is measuring business performance. A knowledge graph is built for meaning and relationships. It connects entities like customers, products, policies, and systems into a semantic model that machines can traverse and reason over. In short: warehouses answer "what happened?" well; knowledge graphs are better at "how are these things connected, and what does that imply?"
Knowledge Graph vs. Graph Database
A graph database is the storage and query technology for graph-shaped data. It manages nodes, edges, and traversals efficiently. A knowledge graph is the broader semantic system layered on top: data model, entity definitions, identity resolution, metadata, and often reasoning rules. A graph database can power a knowledge graph, but it can also store simpler network data without shared business meaning. Not every graph database implementation becomes a knowledge graph.
Knowledge Graph vs. Ontology
An ontology defines the concepts, classes, properties, and constraints in a domain. It is the schema or semantic blueprint. A knowledge graph uses an ontology to organize real-world data consistently, but it also includes the actual entities and relationships populated from enterprise systems. The ontology defines the model; the knowledge graph instantiates it with live data.
Knowledge Graph vs. Master Data Management (MDM)
Master data management creates governed golden records for core business entities—customers, products, suppliers, locations. A knowledge graph goes further by modeling how those entities connect to each other and to the systems, processes, and policies around them. MDM answers "which record is the master?"; a knowledge graph answers "how does this entity relate to everything else?" In practice, many enterprises use both: MDM for record-level governance and a knowledge graph for cross-domain context and AI grounding.
Knowledge Graph vs. Semantic Layer
A semantic layer defines business-friendly metrics, dimensions, and entity definitions that sit between raw data and analytics tools. A knowledge graph models entities, relationships, and reasoning rules in a traversable structure. The semantic layer improves consistency for reporting and BI; the knowledge graph provides deeper relational context for AI, search, and cross-system integration. In modern enterprise architectures, the two are complementary—the semantic layer handles metric governance while the knowledge graph handles entity and relationship intelligence.
Comparison Table
Approach | Best Use Cases | Strengths | Limits |
|---|---|---|---|
Knowledge Graph | Data integration, AI grounding, semantic search, recommendations | Rich context, explicit relationships, reusable semantics | More modeling effort, governance required |
Data Warehouse | BI, dashboards, KPI reporting, historical analytics | Fast aggregation, mature tooling, SQL-friendly | Weak at representing complex relationships and meaning |
Graph Database | Fraud, network analysis, dependency mapping, path queries | Fast traversals, flexible graph storage | Does not provide semantic model by itself |
Ontology | Domain modeling, standard definitions, interoperability | Shared vocabulary, constraints, consistency | Not a full data system without populated graph data |
MDM | Golden records, data stewardship, regulatory compliance | Governed master data, deduplication, data quality | Focused on records, not cross-domain relationships |
Semantic Layer | BI consistency, metric governance, self-service analytics | Shared definitions, SQL-friendly, tool-agnostic | Limited to metrics and dimensions, not entity reasoning |
What a Knowledge Graph Is Used For
A knowledge graph is used to make enterprise data usable across search, analytics, and AI. Instead of leaving information trapped in separate systems, it connects entities like customers, products, policies, metrics, and documents into a shared semantic model.
Enterprise Search and Discovery
A knowledge graph improves retrieval by adding meaning, not just keywords. Search systems can understand that two terms may refer to the same concept, that a person belongs to a team, or that a product is tied to a contract, region, or account. This helps users find the right answer faster, especially in large organizations where the same concept appears in many tools and formats.
Data Integration and Semantic Unification
A knowledge graph acts as a connective layer across warehouses, applications, and metadata systems. It maps different schemas and business terms into a common structure, so teams can unify fragmented data without forcing everything into one physical system. This is especially useful when enterprises need to reconcile inconsistent definitions across domains, business units, or acquired companies.
AI and Retrieval-Augmented Generation
A knowledge graph gives models structured context. It can improve retrieval quality, reduce ambiguity, and help AI systems reason over relationships instead of isolated chunks of text. In practice, that means better grounding for copilots, agents, and question-answering systems built on internal data, especially when accuracy depends on connected business context.
Governance, Lineage, and Compliance
A knowledge graph helps trace where data came from, how it changed, who owns it, and which policies apply. Because relationships are explicit, organizations can connect data assets to definitions, controls, and downstream usage. That makes it easier to support audits, enforce governance rules, and understand the impact of changes across the data estate.
When a Knowledge Graph Makes Sense
A knowledge graph makes sense when the core problem is semantic, not just structural. Typical signs include inconsistent definitions across teams, duplicate entities across systems, weak lineage between data assets, and repeated manual work to reconcile customers, products, suppliers, or business concepts. If the challenge is "what does this data mean and how does it connect?", not just "where is it stored?", a knowledge graph is often the right fit.
Common business scenarios include enterprise data integration, master data harmonization, regulatory traceability, supply chain intelligence, customer 360, and analytics environments where context must persist across many systems. Knowledge graphs are especially useful when relationships change over time, when multiple identifiers refer to the same entity, or when downstream AI and search experiences depend on precise context.
Simpler tools may be enough when the problem is narrow, stable, and mostly tabular. If a standard BI model, relational schema, taxonomy, or rules-based mapping can solve the issue without ongoing entity resolution or cross-domain reasoning, a full knowledge graph may be unnecessary. Use a knowledge graph when meaning and relationships are the hard part, not just storage or reporting.
How to Evaluate Knowledge Graph Solutions
Choosing a knowledge graph solution comes down to one question: can it model enterprise context well enough to support search, analytics, and AI at production scale?
Key Buying Criteria
The strongest buying criteria are data modeling flexibility, integration depth, reasoning capability, governance, and time to value. Buyers should assess whether the platform supports RDF, LPG, or both; handles ontology management cleanly; connects to existing warehouses, catalogs, APIs, and unstructured sources; and can enforce lineage, access controls, and data quality. For AI use cases, evaluate support for GraphRAG, semantic search, entity resolution, and explainable reasoning.
Questions to Ask Vendors
Vendor conversations should focus on proof, not promises. Ask: What data models are supported? How are ontologies created and maintained? How does the system ingest structured and unstructured data? What native support exists for entity resolution, inference, and retrieval for LLM workflows? How are governance, lineage, and role-based permissions handled? What does a typical implementation timeline look like? Which use cases are already live in production?
Build vs. Buy vs. Hybrid
Approach | Best For | Advantages | Tradeoffs |
|---|---|---|---|
Build | Teams with strong graph engineering resources | Maximum flexibility, full control, tailored architecture | Slowest time to value, highest implementation risk, ongoing maintenance burden |
Buy | Enterprises needing faster deployment | Faster rollout, packaged governance and connectors, vendor support | Less flexibility, platform constraints, recurring license cost |
Hybrid | Teams with specific requirements but limited bandwidth | Balance of speed and customization, easier integration with existing stack | More architectural complexity, requires clear ownership boundaries |
In practice, most enterprises should start with a hybrid lens: buy the core platform, then extend where differentiation matters. For detailed platform comparisons, see the enterprise knowledge graph platforms buyer's guide and top knowledge graph platforms for data intelligence.
Challenges and Tradeoffs
Knowledge graphs can create major upside, but the path is rarely simple.
Modeling complexity. Teams need to decide what entities, relationships, and business rules matter enough to encode. If the model is too narrow, it misses important context. If it is too broad, delivery slows and the graph becomes hard to govern. This is why ontology design is a strategic tradeoff, not just a technical task.
Data quality and ontology discipline. A knowledge graph only works if source systems are mapped consistently and definitions stay stable over time. Duplicate entities, weak metadata, and conflicting schemas can reduce trust fast. Poor ontology design creates the same problem at a higher level: the graph may be technically complete but still hard for analysts, applications, or AI systems to use correctly.
Adoption, maintenance, and time-to-value. Knowledge graphs often require cross-functional alignment across data, engineering, governance, and business teams. That raises implementation overhead. Ongoing maintenance also matters because source systems, taxonomies, and business concepts change. The tradeoff is clear: stronger semantic structure can improve reuse, reasoning, and interoperability, but only if the organization is willing to invest in sustained stewardship and phased rollout.
Choosing the Right Path
Decision Checklist for Teams
Choosing a knowledge graph platform starts with one practical question: is the goal a standalone graph database, a governance layer, or a semantic infrastructure that unifies business context across systems? Teams should evaluate how well each option handles ontology management, schema mapping, entity resolution, governance, and integration with warehouses, BI tools, and AI workflows. A useful checklist includes: support for automated semantic modeling, ability to connect ERP and CRM data, reasoning and search capabilities, security controls, and how quickly business teams can operationalize the model.
What to Do Next If Evaluating Platforms
If the evaluation is centered on creating a reusable semantic foundation for analytics and AI, Galaxy is the semantic infrastructure option to consider. It is positioned around semantic data unification, enterprise ontology design, and a unified metadata layer that connects operational and analytical systems. Next steps should include shortlisting platforms, validating integration fit, and running a scoped proof of value on a high-impact domain such as customer or product data.
Frequently Asked Questions
What is a knowledge graph in simple terms? A knowledge graph is a structured way to represent real-world entities—like customers, products, systems, or policies—and the relationships between them. Instead of storing data only in tables, it connects meaning across sources. For enterprise teams, that makes it easier to unify fragmented data, improve search and analytics, and support AI use cases with better context. (Neo4j, Google Cloud)
How is a knowledge graph different from a database? A knowledge graph is not necessarily a replacement for a database. It is a way to model and connect meaning across data. Traditional databases store records efficiently, while knowledge graphs emphasize relationships, semantics, and context. In practice, enterprises often use a knowledge graph alongside warehouses, lakes, and operational systems to unify data across the stack. (AWS, IBM)
Why do enterprises use knowledge graphs? Enterprises use knowledge graphs to connect siloed data, create shared business meaning, and improve trust in downstream analytics and AI. Common use cases include customer 360, master data, semantic search, fraud detection, recommendation systems, and governance. The main value is better decision-making from connected, explainable data rather than isolated records.
What problems does a knowledge graph solve? A knowledge graph helps solve entity duplication, inconsistent definitions, weak lineage, and disconnected systems. For example, one customer may appear differently across CRM, ERP, and support tools. A graph can connect those records under shared meaning and relationships, reducing ambiguity and giving teams a more complete view of business entities. (Neo4j, Stardog)
Is a knowledge graph the same as a semantic layer? Not exactly. A semantic layer defines business-friendly meaning for data, such as metrics, entities, and dimensions. A knowledge graph can support that by modeling entities and relationships in a flexible, connected structure. In many enterprise architectures, the two are complementary: the semantic layer improves access and consistency, while the knowledge graph provides deeper relational context.
How does a knowledge graph help AI and LLM applications? Knowledge graphs give AI systems structured context that can improve retrieval, grounding, and explainability. They help connect entities, synonyms, hierarchies, and business rules that raw documents alone may miss. For enterprise AI, this can reduce hallucinations and improve relevance, especially in search, copilots, and question-answering systems built on internal data.
What are the core components of a knowledge graph? Most knowledge graphs include entities, relationships, identifiers, schemas or ontologies, and metadata. Entities represent things like people, products, or systems. Relationships describe how those things connect. Ontologies or semantic models define shared meaning. Together, these components create a machine-readable layer that helps enterprises integrate data and reason across complex environments. (W3C RDF, W3C OWL)
When should a company invest in a knowledge graph? A company should consider a knowledge graph when critical data is spread across many systems, business definitions are inconsistent, or AI and analytics need more context than tables alone can provide. It is especially useful when relationships matter, such as linking customers, products, contracts, policies, and events across domains in a governed, reusable way.
Interested in learning more about Galaxy?


" height="24px" id="PKt6RW0lu" width="24px"/></g></svg>)
" height="23.247157673850985px" id="M3DBdZhx2" width="24px"/></g></g></svg>)
" height="24.5274px" id="bTanG43xy" width="24px"/></g></svg>)
